Live Tracking a Peloton Class
One of the most powerful features of mPaceline Pulse is its ability to live-track a class while it’s in progress. This works whether you’re riding on Peloton equipment or using the Peloton App with third-party equipment.
Once a Peloton class begins, mPaceline Pulse automatically recognizes it and loads the class details—including the full class structure, instructor cues, and timing. This allows mPaceline Pulse to provide enhanced guidance and visual feedback beyond what’s available in Peloton alone.
Important: Before starting, make sure you’ve connected your Bike, Tread, or Rower.
How to Live Track a Peloton Class
Follow the next two steps to live track your Peloton Class in mPaceline Pulse.
1. Open the New Workout Screen
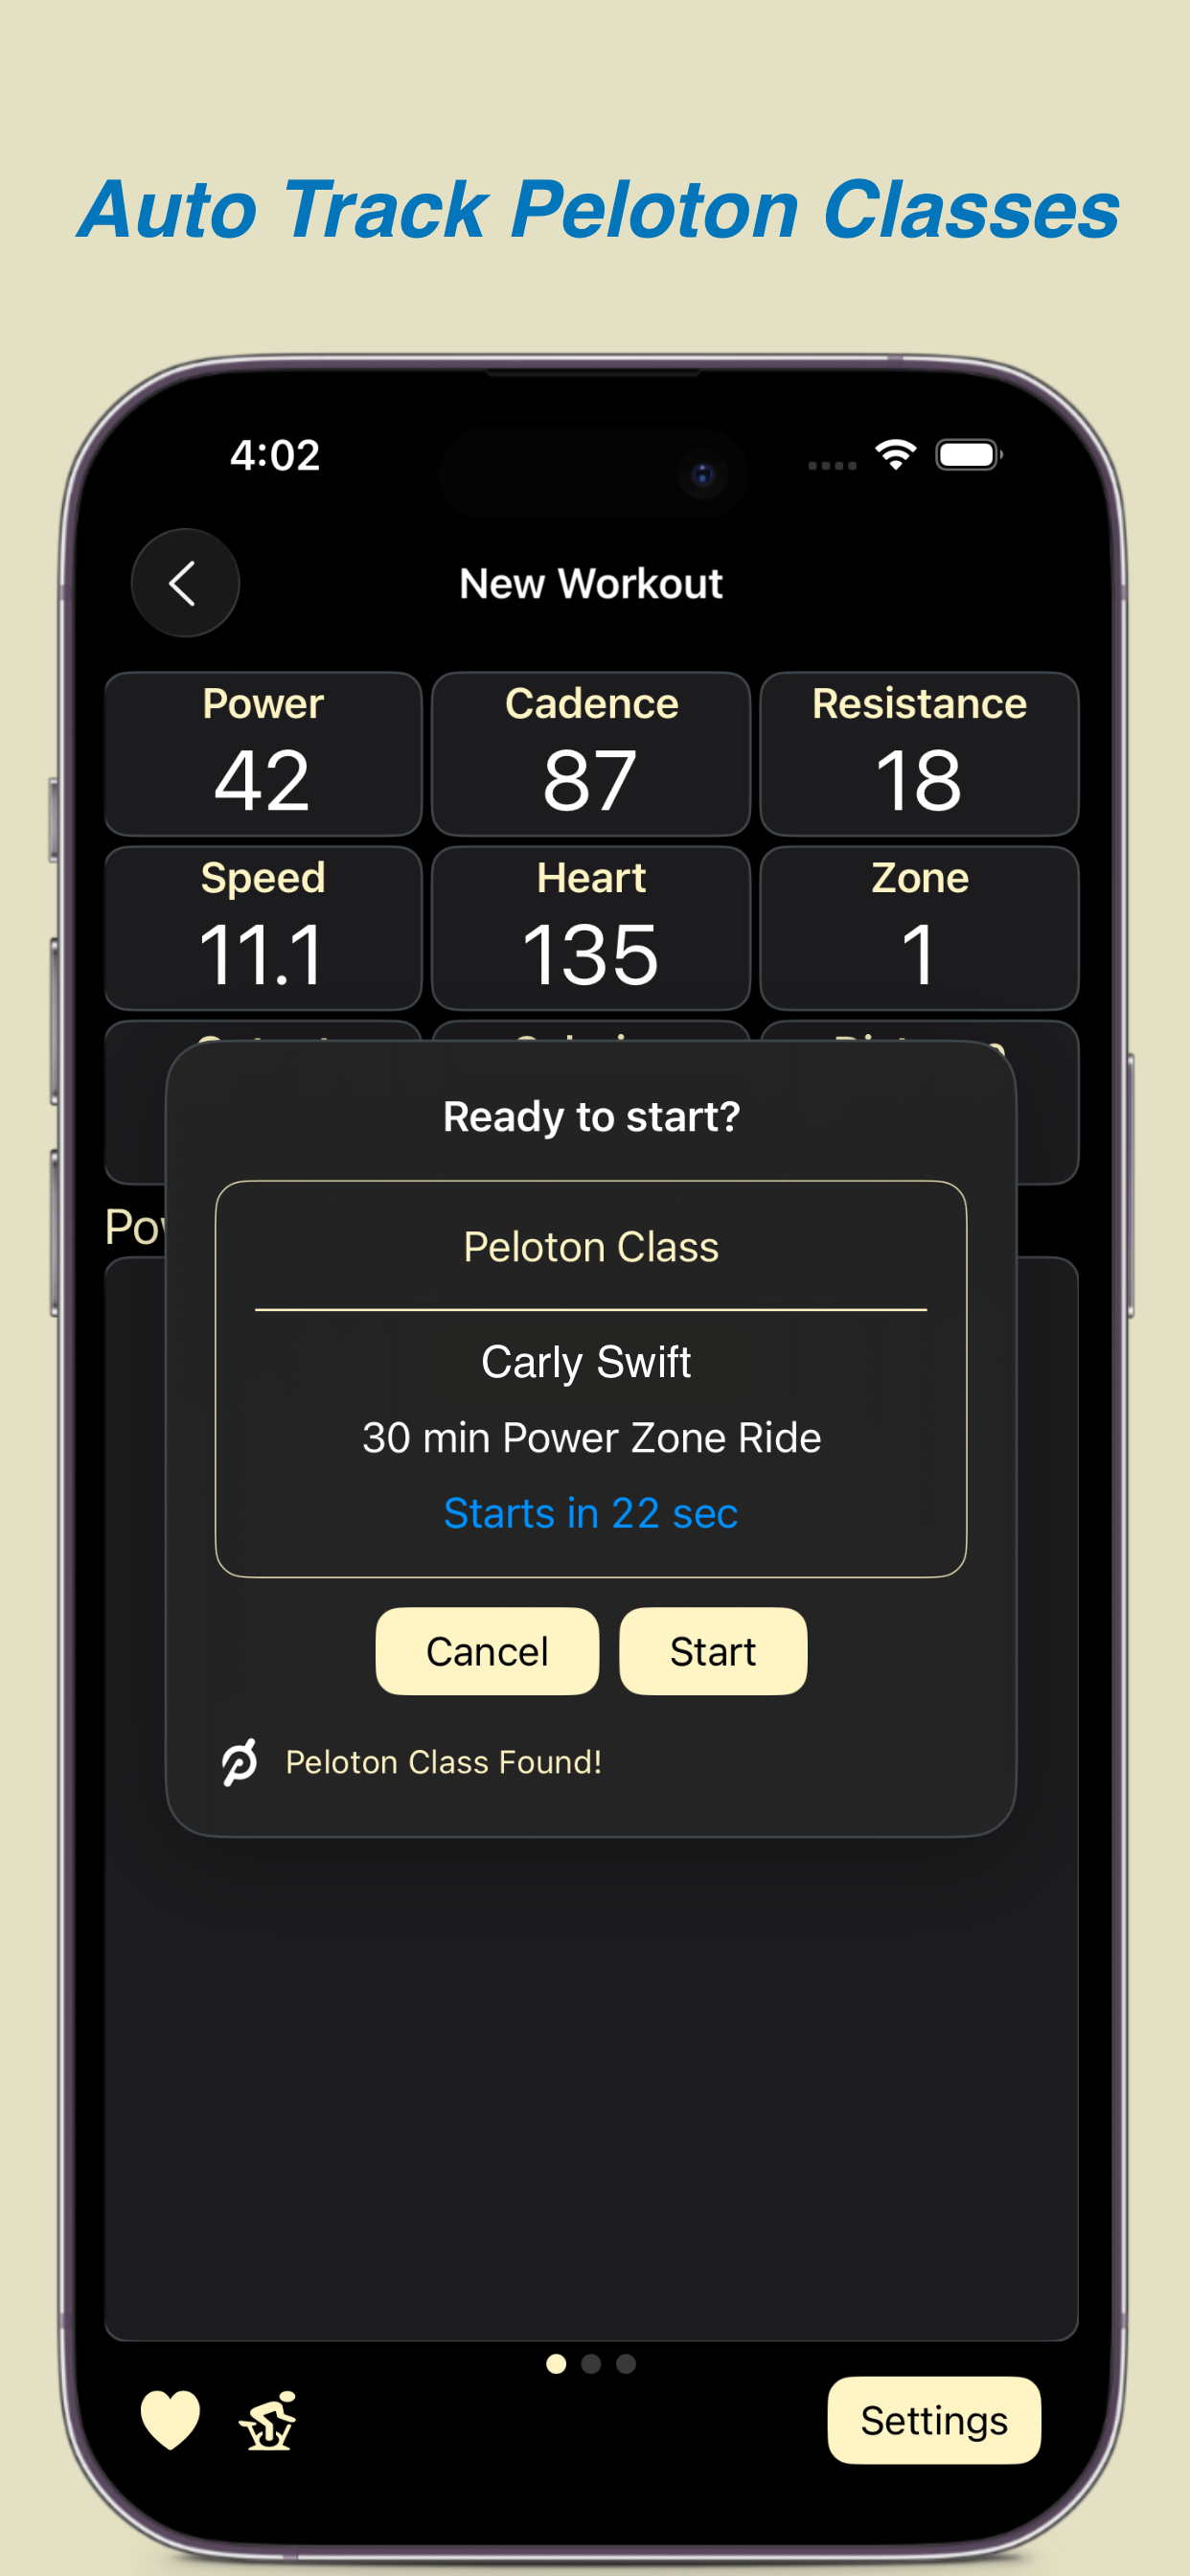
From the Home screen, tap New Workout in the upper-left corner. The ‘Ready to Start’ screen will appear.
At this point, mPaceline Pulse begins searching for an active Peloton class using your Peloton credentials. It will continue searching for about 90 seconds before timing out.
-
You’ll see a message and activity indicator while the app is searching
-
If the search stops before your Peloton class has started, tap ‘Try Again’ to resume searching
2. Start your Peloton Class
Start your class on your Bike, Tread, Row, or in the Peloton App.
Once the class begins:
-
The ‘Ready to Start’ screen automatically disappears
-
The ‘New Workout’ screen opens and live tracking begins
You may see a countdown timer at the top of the screen if the class is still in the warm-up phase. Once the timer ends, metrics and graphs will begin updating in real time.
New Workout Screen Details
There are two parts to the New Workout Screen:
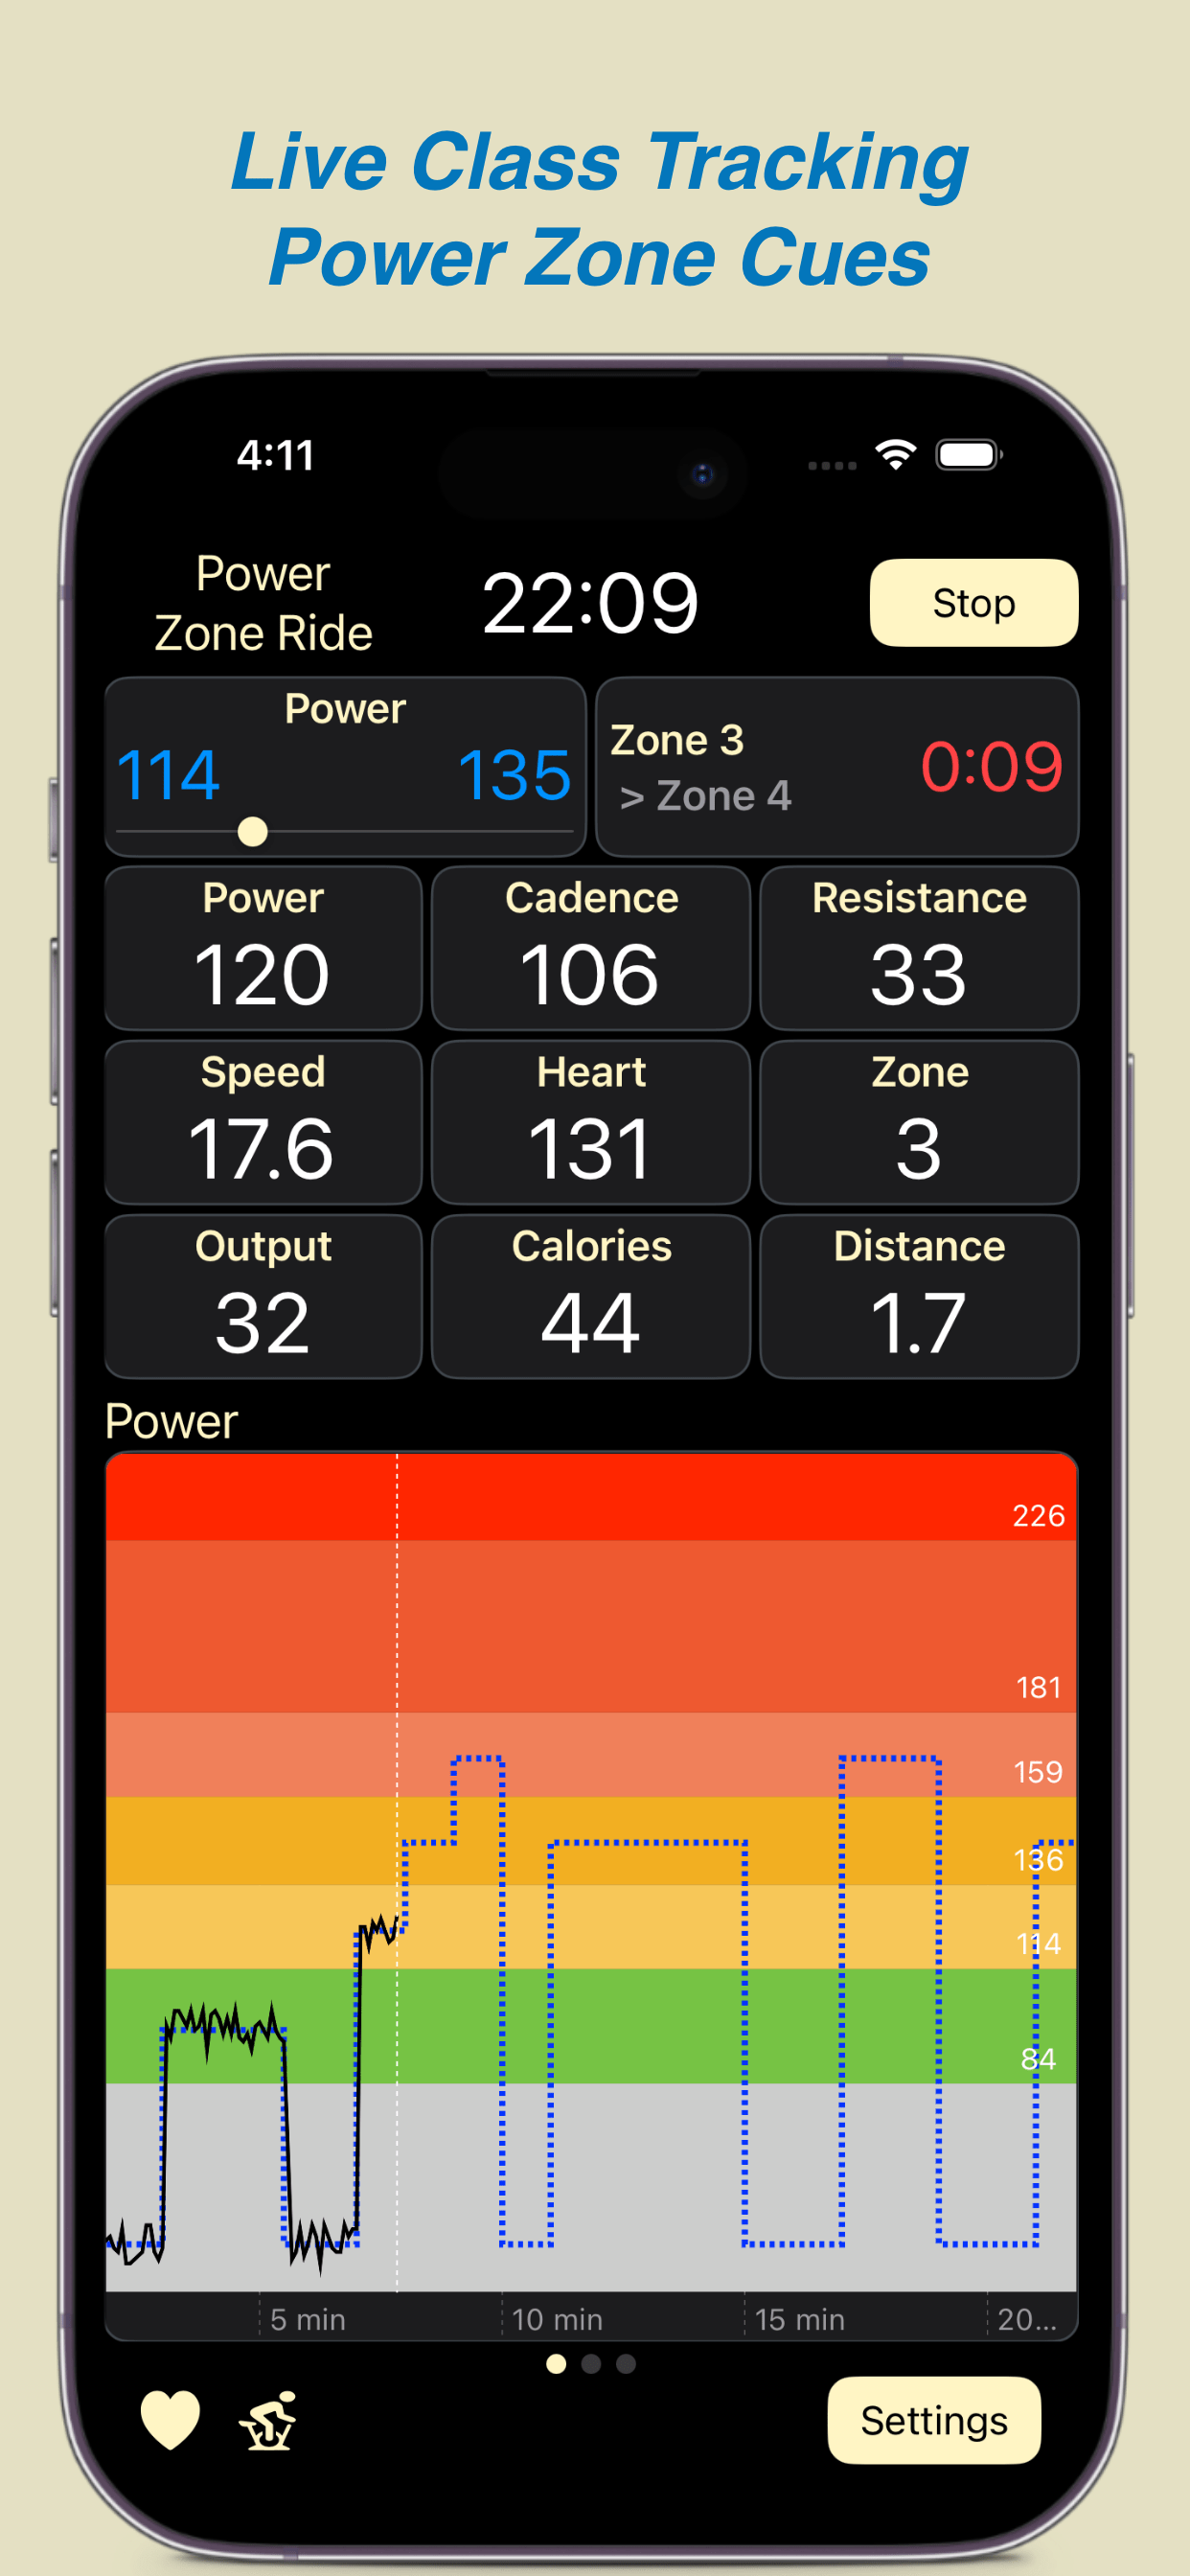
Top Section: Live Metrics
This area displays live data streamed from your equipment, such as power, cadence, heart rate, pace, and other device-specific metrics.
Bottom Section: Class Graphs
This area shows the class graphs, typically:
-
Power
-
Cues
-
Heart Rate
Swipe left or right to switch between graphs.
Note that the Cues graph adapts based on your equipment:
-
Bike: cadence and resistance
-
Tread: pace and incline
-
Rower: stroke rate and resistance
Class Power Structure
For Cycling and Rowing classes, you’ll see a blue dotted line representing the class’s Power structure. As the class progresses, your actual power output is plotted on top of this structure, making it easy to see how closely you’re following the instructor’s targets.
If your class is a Power Zone Class, then depending on your ‘Power Zone Gauge’ setting in ‘Live Class Settings’, you’ll also see:
-
The current cued zone
-
Upcoming zone cues
-
Duration for each zone – current and upcoming
This makes it easy to anticipate zone changes and stay ahead of instructor cues.
Cues Graph
For non-Power Zone classes, instructor cues are shown on the Cues graph and reinforced in the metrics section.
For example:
-
In a cycling class, cadence and resistance ranges are displayed visually and numerically
-
In running and rowing classes, the graphs and metrics adapt to show the appropriate effort ranges for those disciplines
Meter Status
In the bottom-left corner of the screen, you’ll see which meters are currently connected.
-
These correspond to the devices configured in Settings → Bluetooth
-
If you’re using Peloton equipment, this will be indicated here as well
Live Class Settings
To customize the live class experience or adjust the New Workout display, tap the Settings button in the bottom-right corner of the screen.